
- Urban Ecology • Lahore & the River Ravi
Our Planet
Lahore’s river, aquifer, air and green cover are under severe strain. This page brings together the best available evidence on each, with every figure linked to its published source.
- Lahore & the River Ravi
- Figures from published sources, 2014–2026
Why It Matters
A city that depends on the river it pollutes
Lahore draws almost all of its water from the ground, and the River Ravi supplies about 82% of the aquifer’s recharge [5]. The same river receives the city’s wastewater untreated [3]. Lahore’s air is among the most polluted of any city in the world [2], and its green cover has shrunk as the city has spread [7].
These pressures fall hardest on the urban poor, who have the least protection from contaminated water, heat and smoke. PURC documents them so that planning decisions can be made on evidence.
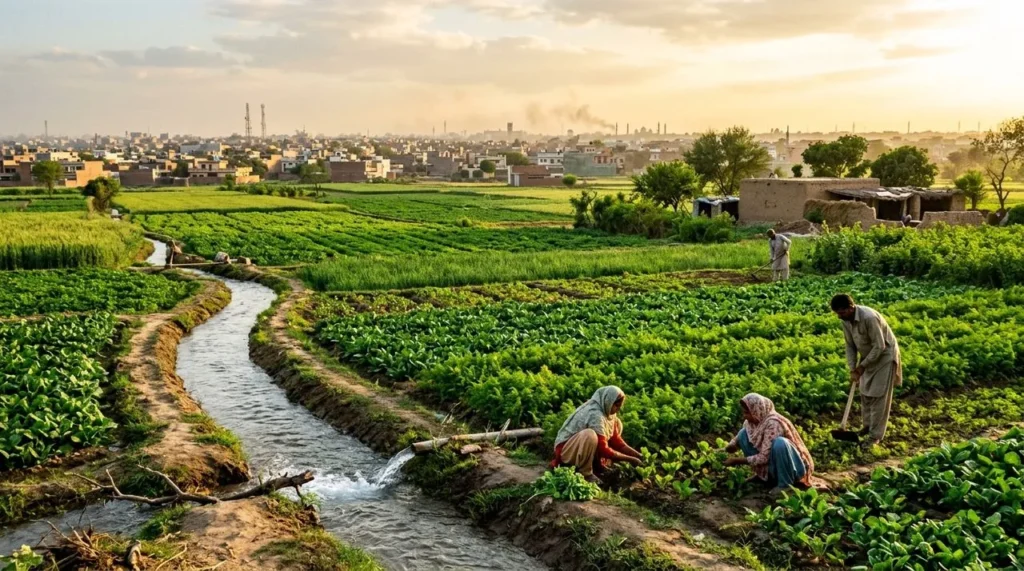
Land and water at the city’s edge
The Evidence
Air, River and Aquifer
The systems Lahore’s residents depend on most, and what the published evidence says about their condition.
- Water // River Ravi
Wastewater reaching the River Ravi each day, an estimated
640 MGD
million gallons a day, with no functioning treatment plant in the city
- Groundwater // Aquifer
Between 2003 and 2020, Lahore’s groundwater level fell by an average of
0.49 m/yr
while land subsidence in the city centre accelerated
Sajjad et al., Remote Sensing, 2023 [6]
Green Cover & Heat
A Hotter, Harder City
Satellite studies show how Lahore’s growth has replaced vegetation with built-up land.
- Land // Vegetation
Lahore’s vegetation cover fell from 60.5% in 1990 to
47.7%
in 2020
Farid et al., Frontiers in Remote Sensing, 2022 [7]
- Heat // Surface heat island
Over the same period, the city’s surface urban heat island grew from 1.72°C to
2.41°C
in 2020
Farid et al., Frontiers in Remote Sensing, 2022 [7]
- Growth // Urban expansion
Between 2010 and 2020, Lahore’s urban area grew by about
26.4 km²
every year
Azhar et al., Geography, Environment, Sustainability, 2024 [8]
In Depth
The River and the Air
Two connected emergencies shaping daily life in Lahore.
- The River Ravi
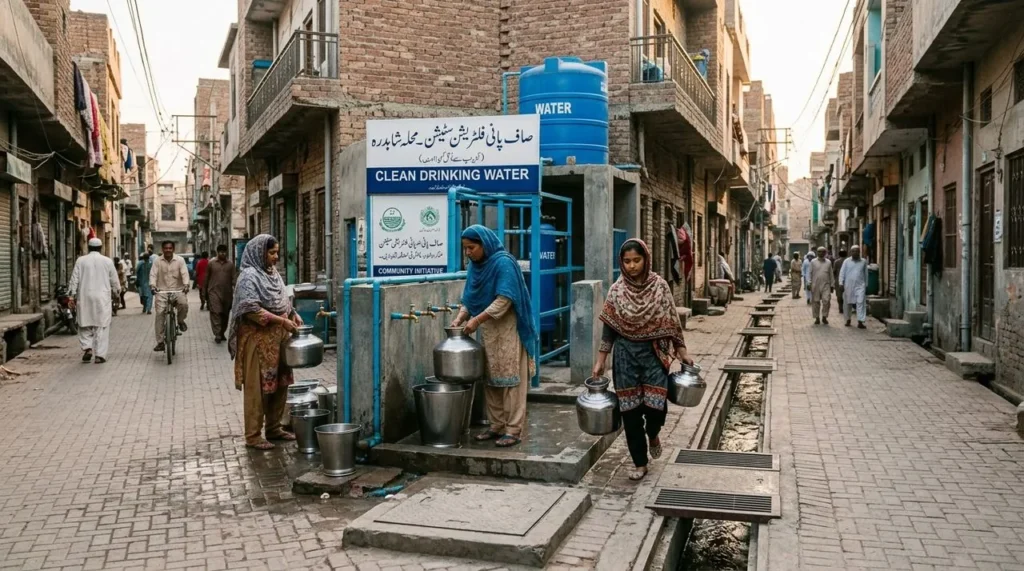
Lahore’s sewage reaches the Ravi untreated, and the river provides about 82% of the city’s groundwater recharge.
14 main drains
Wastewater and drinking water are linked
WWF-Pakistan’s 2014 analysis found that the city’s wastewater is collected through a network of 14 main drains and discharged into the Ravi without treatment, with the Babu Sabu drain carrying the largest organic load. Because the river also recharges the aquifer that Lahore drinks from, pollution of the Ravi is a drinking-water problem as well as an ecological one.
- The Air
In 2025, Lahore’s average PM2.5 level was 88.9 µg/m³, nearly 18 times the WHO annual guideline of 5 µg/m³.
88.9 µg/m³ in 2025
Everyone breathes it; some breathe more
All of Pakistan’s 248.8 million people live where annual particulate pollution exceeds the WHO guideline. In Lahore, meeting that guideline would add an estimated 5.8 years to residents’ life expectancy. People who work outdoors, and families in crowded housing without clean cooking or cooling, carry the heaviest exposure.
At a Glance
The Evidence Table
A city is more than real estate and asphalt. It is the river, the aquifer, the trees, and the air its people share.
- River
640
million gallons of wastewater a day
AIIB 2018
- Recharge
82%
of groundwater recharge comes from the Ravi
WWF-Pakistan 2014
- Air
17.8×
the WHO PM2.5 guideline, 2025 average
IQAir 2026
- Ground
106 mm
of land subsidence a year in central Lahore by 2020
Sajjad et al. 2023
Stand for the living commons
Use our research, join our forums, or work with the Punjab Urban Resource Centre on a cleaner river, safer water and breathable air for Lahore.
Sources
Where These Figures Come From
Older figures are marked with their year. If you hold more recent official data, please share it with the PURC Secretariat.
- UChicago Energy Policy Institute (EPIC), Air Quality Life Index — Pakistan Fact Sheet, Annual Update 2025 (2023 data). aqli.epic.uchicago.edu
- IQAir, “Lahore among top 10 most polluted cities in the world”, 8 September 2026 (2025 annual data). iqair.com
- Asian Infrastructure Investment Bank, Project Summary Information: Lahore Water and Wastewater Management Project, 2018. ewsdata.rightsindevelopment.org
- Profit (Pakistan Today), “AIIB approves $235 million loan to overhaul Lahore’s water and wastewater systems”, 12 October 2025. profit.pakistantoday.com.pk
- WWF-Pakistan, Situation Analysis of the Water Resources of Lahore, 2014. eeas.europa.eu
- Sajjad, M., Wang, J., Afzal, Z. et al., “Assessing the Impacts of Groundwater Depletion and Aquifer Degradation on Land Subsidence in Lahore, Pakistan: A PS-InSAR Approach for Sustainable Urban Development”, Remote Sensing 15(22): 5418, 2023. doi.org
- Farid, N., Moazzam, M., Ahmad, S. et al., “Monitoring the Impact of Rapid Urbanization on Land Surface Temperature and Assessment of Surface Urban Heat Island Using Landsat in Megacity (Lahore) of Pakistan”, Frontiers in Remote Sensing 3: 897397, 2022. doi.org
- Azhar, R., Javed, M., Nasar-u-Minallah, M. et al., “Urban transformation in Lahore: three decades of land cover changes, green space decline, and sustainable development challenges”, Geography, Environment, Sustainability 17(2), 2024. doi.org